
R Programming Online Live Class by Experts
Our Training/Internship Process

R Programming - Syllabus, Fees & Duration
THE ART OF R PROGRAMMING
- Why Use R for Your Statistical Work?
- Object-Oriented Programming
- Functional Programming?
- Functional Programming?
- Downloading R from CRAN
- Installing from Source
- Interactive Mode
- Batch Mode
- Variable Scope
- Default Arguments
- Vectors, the R
- Character Strings
- Matrices
- Lists
- Arrays
- Data Frames
- Adding and Deleting Vector Elements
- Obtaining the Length of a Vector
- Matrices and Arrays as Vectors
- Vector Arithmetic and Logical Operations
- Vector Indexing
- Generating Useful Vectors with the : Operator
- Generating Vector Sequences with seq()
- Repeating Vector Constants with rep
- Vector In, Vector Out
- Vector In, Matrix Out
- Using NA
- Using NULL
- Generating Filtering Indices
- Filtering with the subset() Function
- The Selection Function which
- Extended Example: A Measure of Association
- Extended Example: Recoding an Abalone Data Set
- General Matrix Operations
- Performing Linear Algebra Operations on Matrices
- Matrix Indexing
- Filtering on Matrices
- Using the apply() Function
- Extended Example: Finding Outliers
- Adding and Deleting Matrix Rows and Columns
- Changing the Size of a Matrix
- List Indexing
- Adding and Deleting List Elements
- Getting the Size of a List
- Using the lapply() and sapply() Functions
- Naming Columns and Rows
- Accessing Array Elements
- Check if an Item Exists
- Amount of Rows and Columns
- Array Length
- Manipulating Array Elements
- Calculations Across Array Elements
- Accessing Data Frames
- Extracting Subdata Frames
- More on Treatment of NA Values
- Using the rbind() and cbind() Functions and Alternatives .
- Applying apply()
- Extended Example: An Employee Database
- Using lapply() and sapply() on Data Frames
- The tapply() Function
- The split() Function
- The by() Function
- Matrix/Array-Like Operations on Tables
- Extended Example: Extracting a
- The aggregate() Function
- The cut() Function
- Loops
- Looping Over Non vector Sets if-else
- Deciding Whether to Explicitly Call return()
- Returning Complex Objects
- The Scope Hierarchy
- More on ls()
- Functions Have (Almost) No Side Effects
- Writing to Nonlocals with the Super assignment Operator
- Writing to Nonlocals with assign()
- What’s Considered a Replacement Function?
- Text Editors and Integrated Development Environments
- Extended Example
- Cumulative Sums and Products
- Minima and Maxima
- Extended Example: Vector Cross Product
- Set Operations
- Built-In Random Variate Generators
- Obtaining the Same Random Stream in Repeated Runs
- Using the scan() Function
- Using the readline() Function
- Printing to the Screen
- Reading a Data Frame or Matrix from a File
- Reading Text Files
- Introduction to Connections
- Extended Example
- Accessing Files on Remote Machines via URLs
- Writing to a File
- Getting File and Directory Information
- grep()
- nchar()
- paste()
- sprintf()
- substr
- strsplit()
- regexpr()
- Extended Example
- Reading a CSV File
- Analyzing the CSV File
- Writing into a CSV File
- Install xlsx Package
- Reading the Excel File
- Writing the Binary File
- Reading the Binary File
- Reading XML File
- XML to Data Frame
- Install rjson Package
- Read the JSON File
- Convert JSON to a Data Frame
- RMySQL Package
- Connecting R to MySql
- Querying the Tables
- Query with Filter Clause
- Updating Rows in the Tables
- Inserting Data into the Tables
- Creating Tables in MySql
- Dropping Tables in MySql
- The Workhorse of R Base Graphics: The plot() Function
- R - Pie Charts
- R - Bar Charts
- R - Boxplots
- R - Histograms
- R - Line Graphs
- R - Scatterplots
- Starting a New Graph While Keeping the Old Ones
- Extended Example
- Adding Points: The points() Function
- Adding a Legend: The legend() Function
- Adding Text: The text() Function
- Pinpointing Locations: The locator() Function
- Restoring a Plot
- Customizing Graphs
- Changing Character Sizes: The cex
- Changing the Range of Axes: The xlim and ylim Options
- Graphing Explicit Functions
- Extended Example
- R Graphics Devices
- Saving the Displayed Graph
- Closing an R Graphics Device
INTRODUCTION
INSTALLING R
GETTING STARTED
How to Run R
First R Session
Introduction to Functions
Preview of Some Important R Data Structures
VECTORS
Scalars, Vectors, Arrays, and Matrices
Declarations
Common Vector Operations
Vectorized Operations
NA and NULL Values
Filtering
A Vectorized if-then-else: The ifelse() Function
Testing Vector Equality
Vector Element Names
More on c()
MATRICES AND ARRAYS
Creating Matrices
Applying Functions to Matrix Rows and Columns
More on the Vector/Matrix Distinction
Avoiding Unintended Dimension Reduction
Naming Matrix Rows and Columns
Higher-Dimensional Arrays
LISTS
Creating Lists
General List Operations
Accessing List Components and Values
Applying Functions to Lists
ARRAYS
DATA FRAMES
Creating Data Frames
Other Matrix-Like Operations
Merging Data Frames
Applying Functions to Data Frames
FACTORS AND TABLES
Factors and Levels
Common Functions Used with Factors
Working with Tables
Other Factor- and Table-Related Functions
R PROGRAMMING STRUCTURES
Control Statements
Arithmetic and Boolean Operators and Values
Default Values for Arguments
Return Values
Functions Are Objects
Environment and Scope Issues
The Top-Level Environment
No Pointers in R
Writing Upstairs
When Should You Use Global Variables?
Replacement Functions
Tools for Composing Function Code
The edit() Function
Writing Your Own Binary Operations
Anonymous Functions
DOING MATH AND SIMULATIONS IN R
Math Functions
Functions for Statistical Distributions
Sorting
Linear Algebra Operations on Vectors and Matrices
Simulation Programming in R
INPUT/OUTPUT
Accessing the Keyboard and Monitor
Reading and Writing Files
STRING MANIPULATION
An Overview of String-Manipulation Functions
Regular Expressions
R DATA INTERFACES
R - CSV Files
R - Excel Files
R - Binary Files
R - XML Files
R - JSON Files
R - Database
GRAPHICS
Creating Graphs
Saving Graphs to Files
Creating Three-Dimensional Plots
R Statistics
R Statistics Intro
R Data Set
R Max and Min
R Mean Median Mode
R Percentiles
INSTALLING AND USING PACKAGES
Package Basics
Loading a Package from Your Hard Drive
Downloading a Package from the Web
Installing Packages Automatically
Installing Packages Manually
Listing the Functions in a Package
This syllabus is not final and can be customized as per needs/updates
- Since 2001, Making IT Experts by Experts
- Duration: 40 Hours (Vary as per your skill)
- Course Fees
- Individual Live Classes (1:1)
- Batch Classes @ Low Fees
- Training on Your Time, Any Where
- Access to Recorded Videos
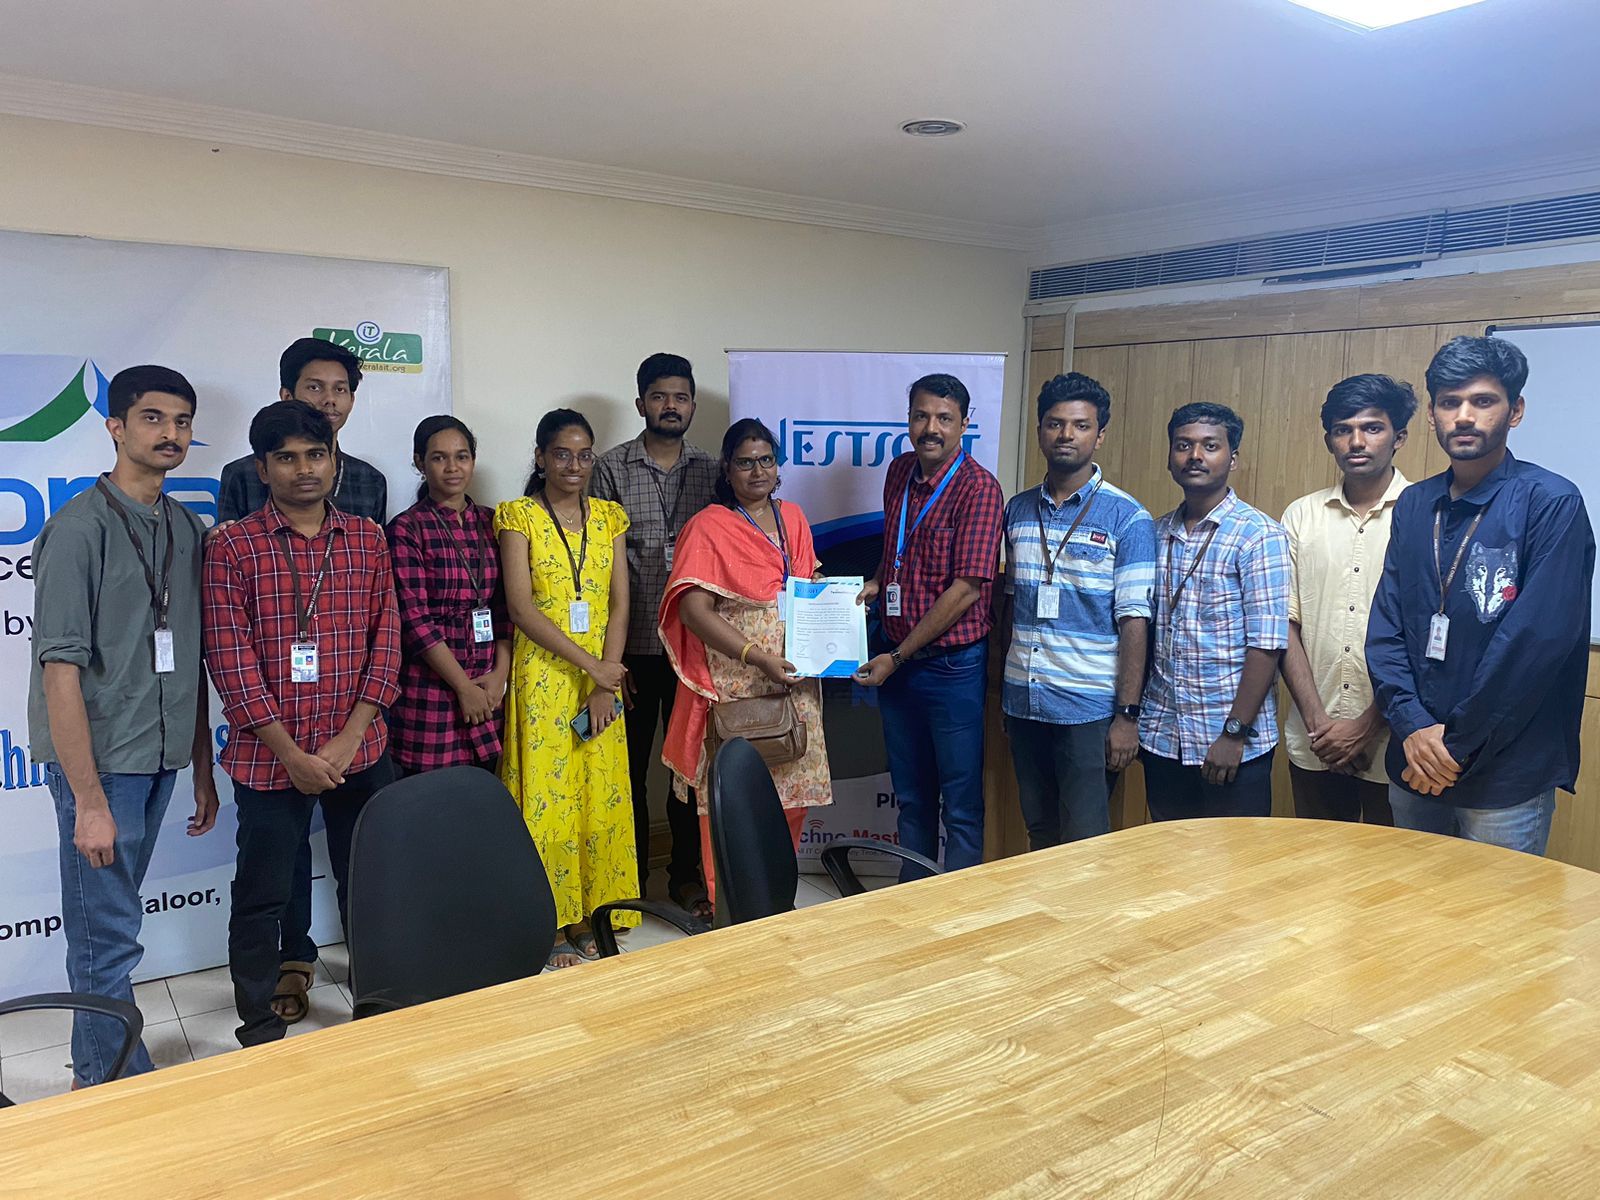
- Practical Internship on Projects
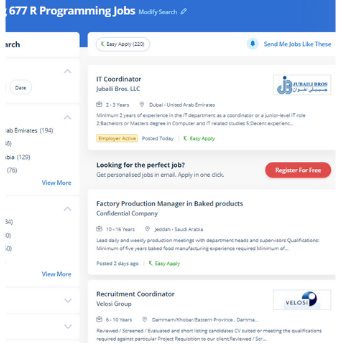
- 100% Placement Support by our jobsNEAR.in
- Training/Internship Certificate
- Abbotsford
- Alberta
- Barrie
- Brampton
- British Columbia
- Burlington
- Calgary
- Charlottetown
- Delta
- Edmonton
- Gatineau
- Guelph
- Halifax
- Hamilton
- Kamloops
- Kelowna
- Kingston
- Kitchener
- Manitoba
- Mississauga
- Moncton
- Montreal
- Nanaimo
- New Brunswick
- Niagara Falls
- Nova Scotia
- Ontario
- Oshawa
- Ottawa
- Peterborough
- Prince George
- Quebec
- Regina
- Saint John
- Saskatoon
- Sherbrooke
- Surrey
- Thunder Bay
- Toronto
- Vancouver
- Victoria
- Waterloo
- Whitehorse
- Windsor
- Winnipeg
Course Highlights

Our Locations

 Our primary goal is to introduce students with the fundamentals and advanced concepts of the R programming language. Students and working professionals can enrol in our top online R Programming training and learn from industry experts who have extensive experience in R Programming advising and R Programming training in Kerala. In R, there are a variety of great packages that can aid in a fast data analysis. R is a computer language that can be used for statistical analysis, reporting, and graphics. You'll learn how to build and setup software for a statistical programming environment, as well as how to represent generic programming language concepts in a high-level statistical language. It is a simple programming language than, other programming languages, would have no requirements. We offer training who do not have a background in statistics. Nestsoft offer the best R programming training, starting with the fundamentals and advancing to complex analytics concepts. Because of its open source credibility, R programming is quickly becoming most in expert in the field of analytics. Nestsoft is the excellent R programming Training in kerala .