Tableau Training by Experts
Our Training Process

Tableau - Syllabus, Fees & Duration
Module 1 - What Is Data Visualization?
- Why Visualization came into Picture?
- Importance of Visualizing Data
- Poor Visualizations Vs. Perfect Visualizations
- Principles of Visualizations
- Tufte’s Graphical Integrity Rule
- Tufte’s Principles for Analytical Design
- Visual Rhetoric
- Goal of Data Visualization
Module 2 - Tableau – Data Visualization Tool
- What is Tableau? Different Products and their functioning
- Architecture Of Tableau
- Pivot Tables
- Split Tables
- Hiding
- Rename and Aliases
Module 3 - Tableau User Interface
- Understanding about Data Types and Visual Cues
Module 4 - Basic Chart Types
- Text Tables, Highlight Tables, Heat Map
- Pie Chart, Tree Chart
- Bar Charts, Circle Charts
Module 5 - Intermediate Chart
- Time Series Charts
- Time Series Hands-On
- Dual Lines
- Dual Combination
Module 6 - Advanced Charts
Module 7 - Maps In Tableau
- Types of Maps in Tableau
- Polygon Maps
- Connecting with WMS Server
- Custom Geo coding
Module 8 - Adding Background Image
Module 9 - Data Connectivity In-Depth Understanding
Module 10 - Creating Calculated Fields
Module 11 - Responsive Tool Tips
- Dashboards
Module 12 - Connecting Tableau With Tableau Server
Module 13 - Connecting Tableau With R
This syllabus is not final and can be customized as per needs/updates


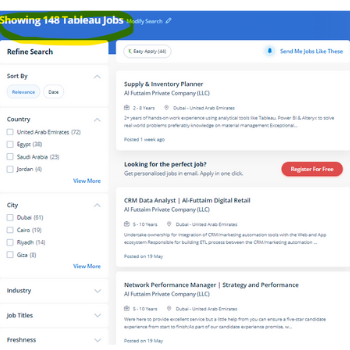
 Data blending, aggregation, and R and its connectivity are also included. Learning Tableau can also be beneficial if you are considering a career change. you learn about job possibilities that no one else would know about if you have a lot of industry connections. Certificate holders for various levels of Tableau competence may significantly assist working professionals to gain the competitive edge they need to grab attention. Tableau is one of the most popular data visualization solutions for data science and business intelligence requirements. Most data analytics specialists now consider it a required skill. The information picked ensures that you fully understand each option. Understanding the tool's essential components and appropriately executing it can help you showcase and deliver data analytics in a lot more polished way. The case studies described near the end will only serve to strengthen your understanding and prepare you to handle real-world tasks and difficulties with Tableau. You can learn how to use Tableau on a number of different platforms.
